Compare county
hazard context.
25 reviewed county pages are live on Climate Atlas. Each page shows FEMA hazard ratings, modeled annual loss, exposure and resilience, plus historical heat, precipitation and El Niño winter context. Browse the county profiles below, compare source labels and download the sample before scoping a portfolio review.
US county modeled loss totals
FEMA lists about $153.75 billion in modeled expected annual loss across 3,232 US counties and county equivalents.
- US modeled expected annual loss
- $153.75 billion
- County records
- 3,232
- Loss per resident
- $459
US state modeled expected annual loss
- ≤ $565.4 million
- ≤ $1.37 billion
- ≤ $2.37 billion
- ≤ $3.35 billion
- ≤ $30.19 billion
State totals show the geographic concentration of modeled expected annual loss; these dollar totals are not state risk ratings.
View chart data
| State | Modeled annual loss |
|---|---|
| Arizona | $3.60 billion |
| Louisiana | $3.35 billion |
| Idaho | $736.3 million |
| Minnesota | $2.58 billion |
| North Dakota | $565.4 million |
| South Dakota | $768.3 million |
| New York | $4.27 billion |
| Alaska | $895.8 million |
| Georgia | $3.35 billion |
| Indiana | $2.37 billion |
| Michigan | $2.85 billion |
| Mississippi | $1.64 billion |
| Ohio | $3.06 billion |
| Texas | $12.35 billion |
| Nebraska | $1.34 billion |
| Colorado | $2.08 billion |
| Maryland | $1.06 billion |
| Kansas | $1.78 billion |
| Illinois | $6.41 billion |
| Wisconsin | $2.59 billion |
| California | $30.19 billion |
| Iowa | $1.83 billion |
| Pennsylvania | $4.07 billion |
| Montana | $753.8 million |
| Missouri | $3.94 billion |
| Florida | $8.79 billion |
| Kentucky | $2.36 billion |
| Maine | $415.9 million |
| Utah | $1.54 billion |
| Oklahoma | $2.12 billion |
| Tennessee | $3.00 billion |
| Oregon | $2.52 billion |
| West Virginia | $999.3 million |
| Arkansas | $1.77 billion |
| Washington | $4.69 billion |
| North Carolina | $4.43 billion |
| Virginia | $1.98 billion |
| Wyoming | $329.5 million |
| Alabama | $2.51 billion |
| South Carolina | $2.99 billion |
| New Mexico | $972.3 million |
| New Hampshire | $462.5 million |
| Vermont | $221.2 million |
| Nevada | $1.37 billion |
| Hawaii | $1.08 billion |
| Massachusetts | $1.48 billion |
| Rhode Island | $216.8 million |
| New Jersey | $3.22 billion |
| Delaware | $377.3 million |
| Connecticut | $1.21 billion |
| District of Columbia | $292.5 million |
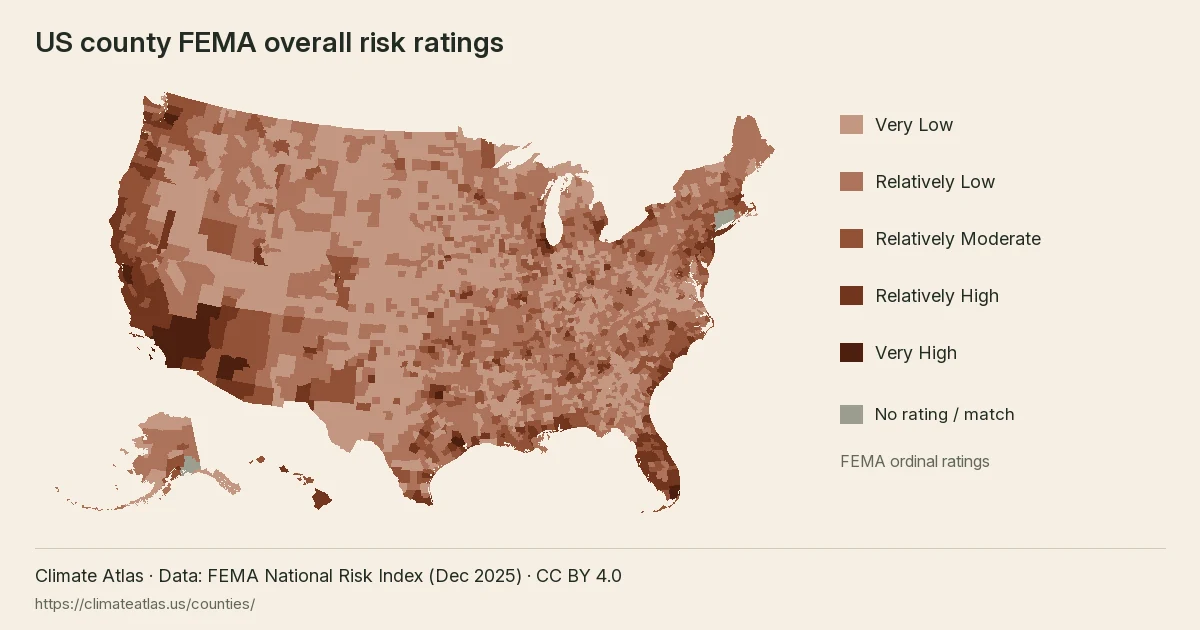
View the full US county risk-rating map →
Reuse this map
Ten largest US county loss estimates
Los Angeles County, CA has the largest modeled expected annual loss in this comparison, about $7.60 billion.
View chart data
| Place | USD / year |
|---|---|
| Los Angeles County, CA | 7,601,846,373.16 |
| Cook County, IL | 2,424,304,449.02 |
| Riverside County, CA | 2,265,637,642.99 |
| Harris County, TX | 2,217,702,382.78 |
| Maricopa County, AZ | 2,195,561,910.06 |
| San Bernardino County, CA | 2,075,099,788.96 |
| Santa Clara County, CA | 1,965,273,927.89 |
| Orange County, CA | 1,926,466,710.37 |
| Alameda County, CA | 1,884,810,318.99 |
| King County, WA | 1,680,266,354.88 |
State county tables
Featured counties
How should I compare county evidence?
Each page keeps source labels, units, observation windows and county codes (FIPS). Compare hazards and modeled losses, then list sources needed for location checks. Missing and non-rating statuses never mean low risk.
Open the five-county comparison ↗
Is a strong El Niño likely this winter?
Review the dated NOAA outlook alongside the historical winter records. See how past strong El Niño winters changed precipitation, temperature and flood claims in each county ↗
All county profiles A–Z
- Allegheny County, Pennsylvania
- Charleston County, South Carolina
- Chittenden County, Vermont
- Clark County, Nevada
- Cook County, Illinois
- Dallas County, Texas
- Denver County, Colorado
- Franklin County, Ohio
- Fulton County, Georgia
- Harris County, Texas
- Hennepin County, Minnesota
- Hillsborough County, Florida
- King County, Washington
- Kings County, New York
- Los Angeles County, California
- Maricopa County, Arizona
- Miami-Dade County, Florida
- Multnomah County, Oregon
- Oklahoma County, Oklahoma
- Philadelphia County, Pennsylvania
- Sacramento County, California
- San Diego County, California
- Shelby County, Tennessee
- Suffolk County, Massachusetts
- Wayne County, Michigan
County profiles by state
Arizona
California
Colorado
Florida
Georgia
Illinois
Massachusetts
Michigan
Minnesota
Nevada
New York
Ohio
Oklahoma
Oregon
Pennsylvania
South Carolina
Tennessee
Texas
Vermont
Washington
Which county pages are live?
| County | Coastal flooding | Riverine flooding | Hurricane | Wildfire | Earthquake | Tornado | Heat wave | Modeled annual loss |
|---|---|---|---|---|---|---|---|---|
| Los Angeles, CA | Relatively High | Very High | No Rating | Very High | Very High | Relatively High | Relatively High | $7,601,846,373 |
| Denver, CO | Not Applicable | Relatively High | Not Applicable | Very Low | Relatively Moderate | Relatively High | Relatively Low | $221,992,551 |
| Miami-Dade, FL | Very High | Very High | Very High | Relatively Moderate | Relatively Low | Relatively High | Relatively High | $824,686,737 |
| Harris, TX | Relatively High | Very High | Very High | Relatively Low | Relatively Moderate | Very High | Very High | $2,217,702,383 |
| Chittenden, VT | Not Applicable | Relatively Moderate | Relatively Low | Very Low | Relatively Low | Relatively Low | Relatively Low | $40,136,955 |
| Maricopa, AZ | Not Applicable | Very High | Very Low | Relatively High | Relatively Moderate | Relatively Moderate | Very High | $2,195,561,910 |
| Sacramento, CA | No Rating | Relatively High | Not Applicable | Relatively Moderate | Relatively High | Relatively Moderate | Relatively Moderate | $352,365,427 |
| San Diego, CA | Relatively Moderate | Very High | Very Low | Very High | Relatively High | Relatively Low | Relatively High | $1,539,181,273 |
| Hillsborough, FL | Relatively High | Relatively High | Very High | Relatively Moderate | Relatively Low | Very High | Relatively High | $494,579,510 |
| Fulton, GA | Not Applicable | Relatively High | Relatively Low | Very Low | Relatively Moderate | Relatively High | Relatively Moderate | $234,593,791 |
| Cook, IL | Relatively Low | Very High | Very Low | Very Low | Relatively High | Very High | Very High | $2,424,304,449 |
| Suffolk, MA | Relatively High | Relatively High | Relatively High | Very Low | Relatively Moderate | Relatively Moderate | Relatively High | $114,876,837 |
| Wayne, MI | Relatively Low | Very High | Very Low | Very Low | Relatively Moderate | Very High | Relatively High | $401,532,840 |
| Hennepin, MN | Not Applicable | Relatively High | Not Applicable | Relatively Low | Very Low | Very High | Relatively High | $456,424,882 |
| Clark, NV | Not Applicable | Very High | No Rating | Relatively High | Relatively High | Very Low | Very High | $812,587,961 |
| Kings, NY | Relatively High | Very High | Relatively High | Very Low | Relatively High | Relatively High | Very High | $374,807,989 |
| Franklin, OH | Not Applicable | Relatively High | Very Low | Very Low | Relatively Moderate | Relatively High | Relatively High | $331,354,855 |
| Oklahoma, OK | Not Applicable | Relatively High | Very Low | Relatively Moderate | Relatively Moderate | Very High | Relatively High | $297,511,340 |
| Multnomah, OR | Relatively Low | Relatively High | Not Applicable | Relatively Low | Relatively High | Relatively Low | Relatively High | $440,430,645 |
| Allegheny, PA | Not Applicable | Very High | Relatively Low | Very Low | Relatively Low | Relatively High | Relatively Moderate | $354,245,204 |
| Philadelphia, PA | Relatively High | Very High | Relatively High | Very Low | Relatively High | Relatively High | Very High | $667,071,998 |
| Charleston, SC | Very High | Relatively Moderate | Very High | Relatively Moderate | Relatively High | Relatively Moderate | Relatively Moderate | $499,798,733 |
| Shelby, TN | Not Applicable | Relatively High | Relatively Low | Relatively Low | Relatively High | Very High | Relatively High | $554,679,744 |
| Dallas, TX | Not Applicable | Very High | Relatively Low | Relatively Low | Relatively Moderate | Very High | Very High | $973,176,569 |
| King, WA | Relatively Moderate | Very High | Not Applicable | Relatively Low | Very High | Relatively Moderate | Relatively High | $1,680,266,355 |
How should I compare counties?
Start with the hazard that matters to your research question. Read riverine and coastal flooding separately. A category describes relative risk, while annualized loss describes modeled financial scale. Neither measure is a forecast for your portfolio. Larger county totals can reflect more people or assets as well as hazard conditions.
Use the county identifier to match your shortlist to the sample. Keep unmatched rows visible until the geography is resolved. Retain the source field, unit and observation window beside every copied value. Preserve No Rating and Not Applicable as labels; neither is a low-risk category or a substitute for zero.
Next, inspect exposure and community resilience. These measures describe county conditions, not the vulnerability of an individual building. Historical climate tables add another view of the area. Their sampling footprints differ from the FEMA county measures, so a change in heat or rain does not validate a hazard rating.
What should I do after choosing a county?
Download the free sample to inspect the fields locally. Use the comparison tool for a shared view of the reviewed counties. Read the methodology before interpreting a difference between places.
For a portfolio review, keep your location list beside the county evidence. Record which questions remain open: mapped flood zones, building condition, insurance and future scenarios need separate work. The county page helps frame those questions and retains the original labels for review.
See pricing for the proposed report scope, or review data access for coverage and format discussions. Confirm the requested counties before ordering. The pilot covers the listed county profiles. It does not provide statewide coverage.
Which counties are covered?
Does Climate Atlas cover every county?
No. This hub links only to the 25 county pages that are built: the five pilot counties and 20 added in November 2026.
What does county context help with?
It helps compare areas and frame the next research question. It does not establish a building-specific conclusion.
Where can I inspect the source fields?
The sample workbook retains the original FEMA field names and labels.